Shop Pulse: know how today is going, from your phone
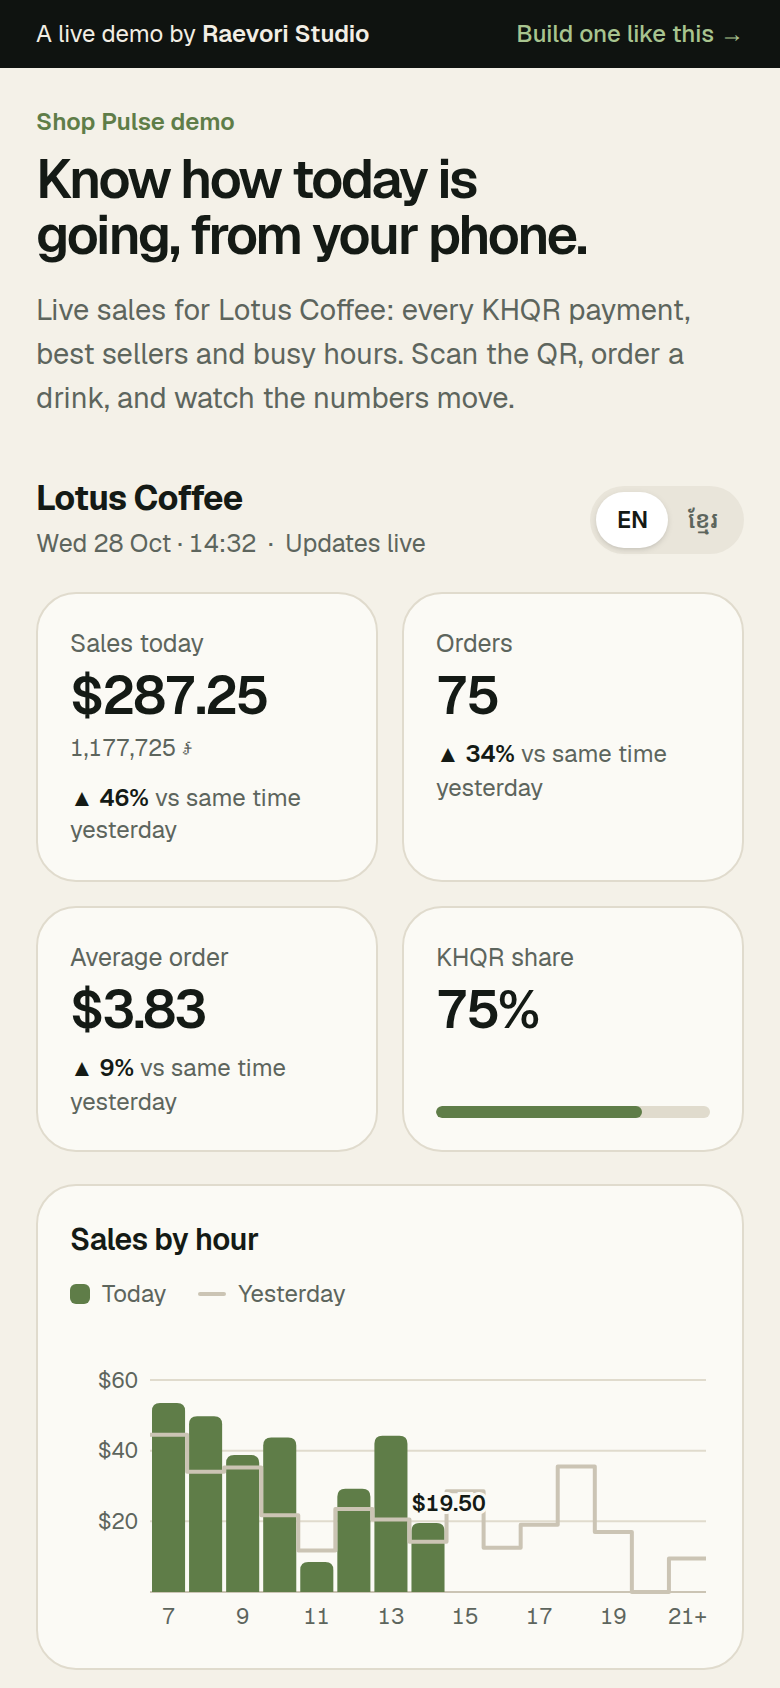
Today’s sales, orders and best sellers on one screen, compared with the same time yesterday. Every KHQR payment lands in the numbers a second later, and the owner gets the day’s report on Telegram at 9 pm.
The numbers arrive too late to act on
A notebook, a till and a phone full of payment alerts.
Most café and shop owners in Phnom Penh find out how the day went after closing, by adding up the till, the notebook and the KHQR alerts on their phone. By then it’s too late to call in more staff or restock the drink that sold out.
The questions are always the same: are we up on yesterday, what’s selling, when is it busy. The answers are in the sales, but nobody has time to dig them out.
Today’s business on one screen
Every part of the demo works. Try it on your own phone.
Every payment, live
Each KHQR sale shows up a second after it’s paid.
Compared with yesterday
Sales, orders and average order against the same time yesterday.
Busy hours
Sales by hour, so staffing follows the rush.
Best sellers
What sells today, by quantity and revenue.
9 pm Telegram report
The day’s numbers arrive as a message at closing.
Khmer and English
In dollars, with riel shown underneath.
Screens from the demo
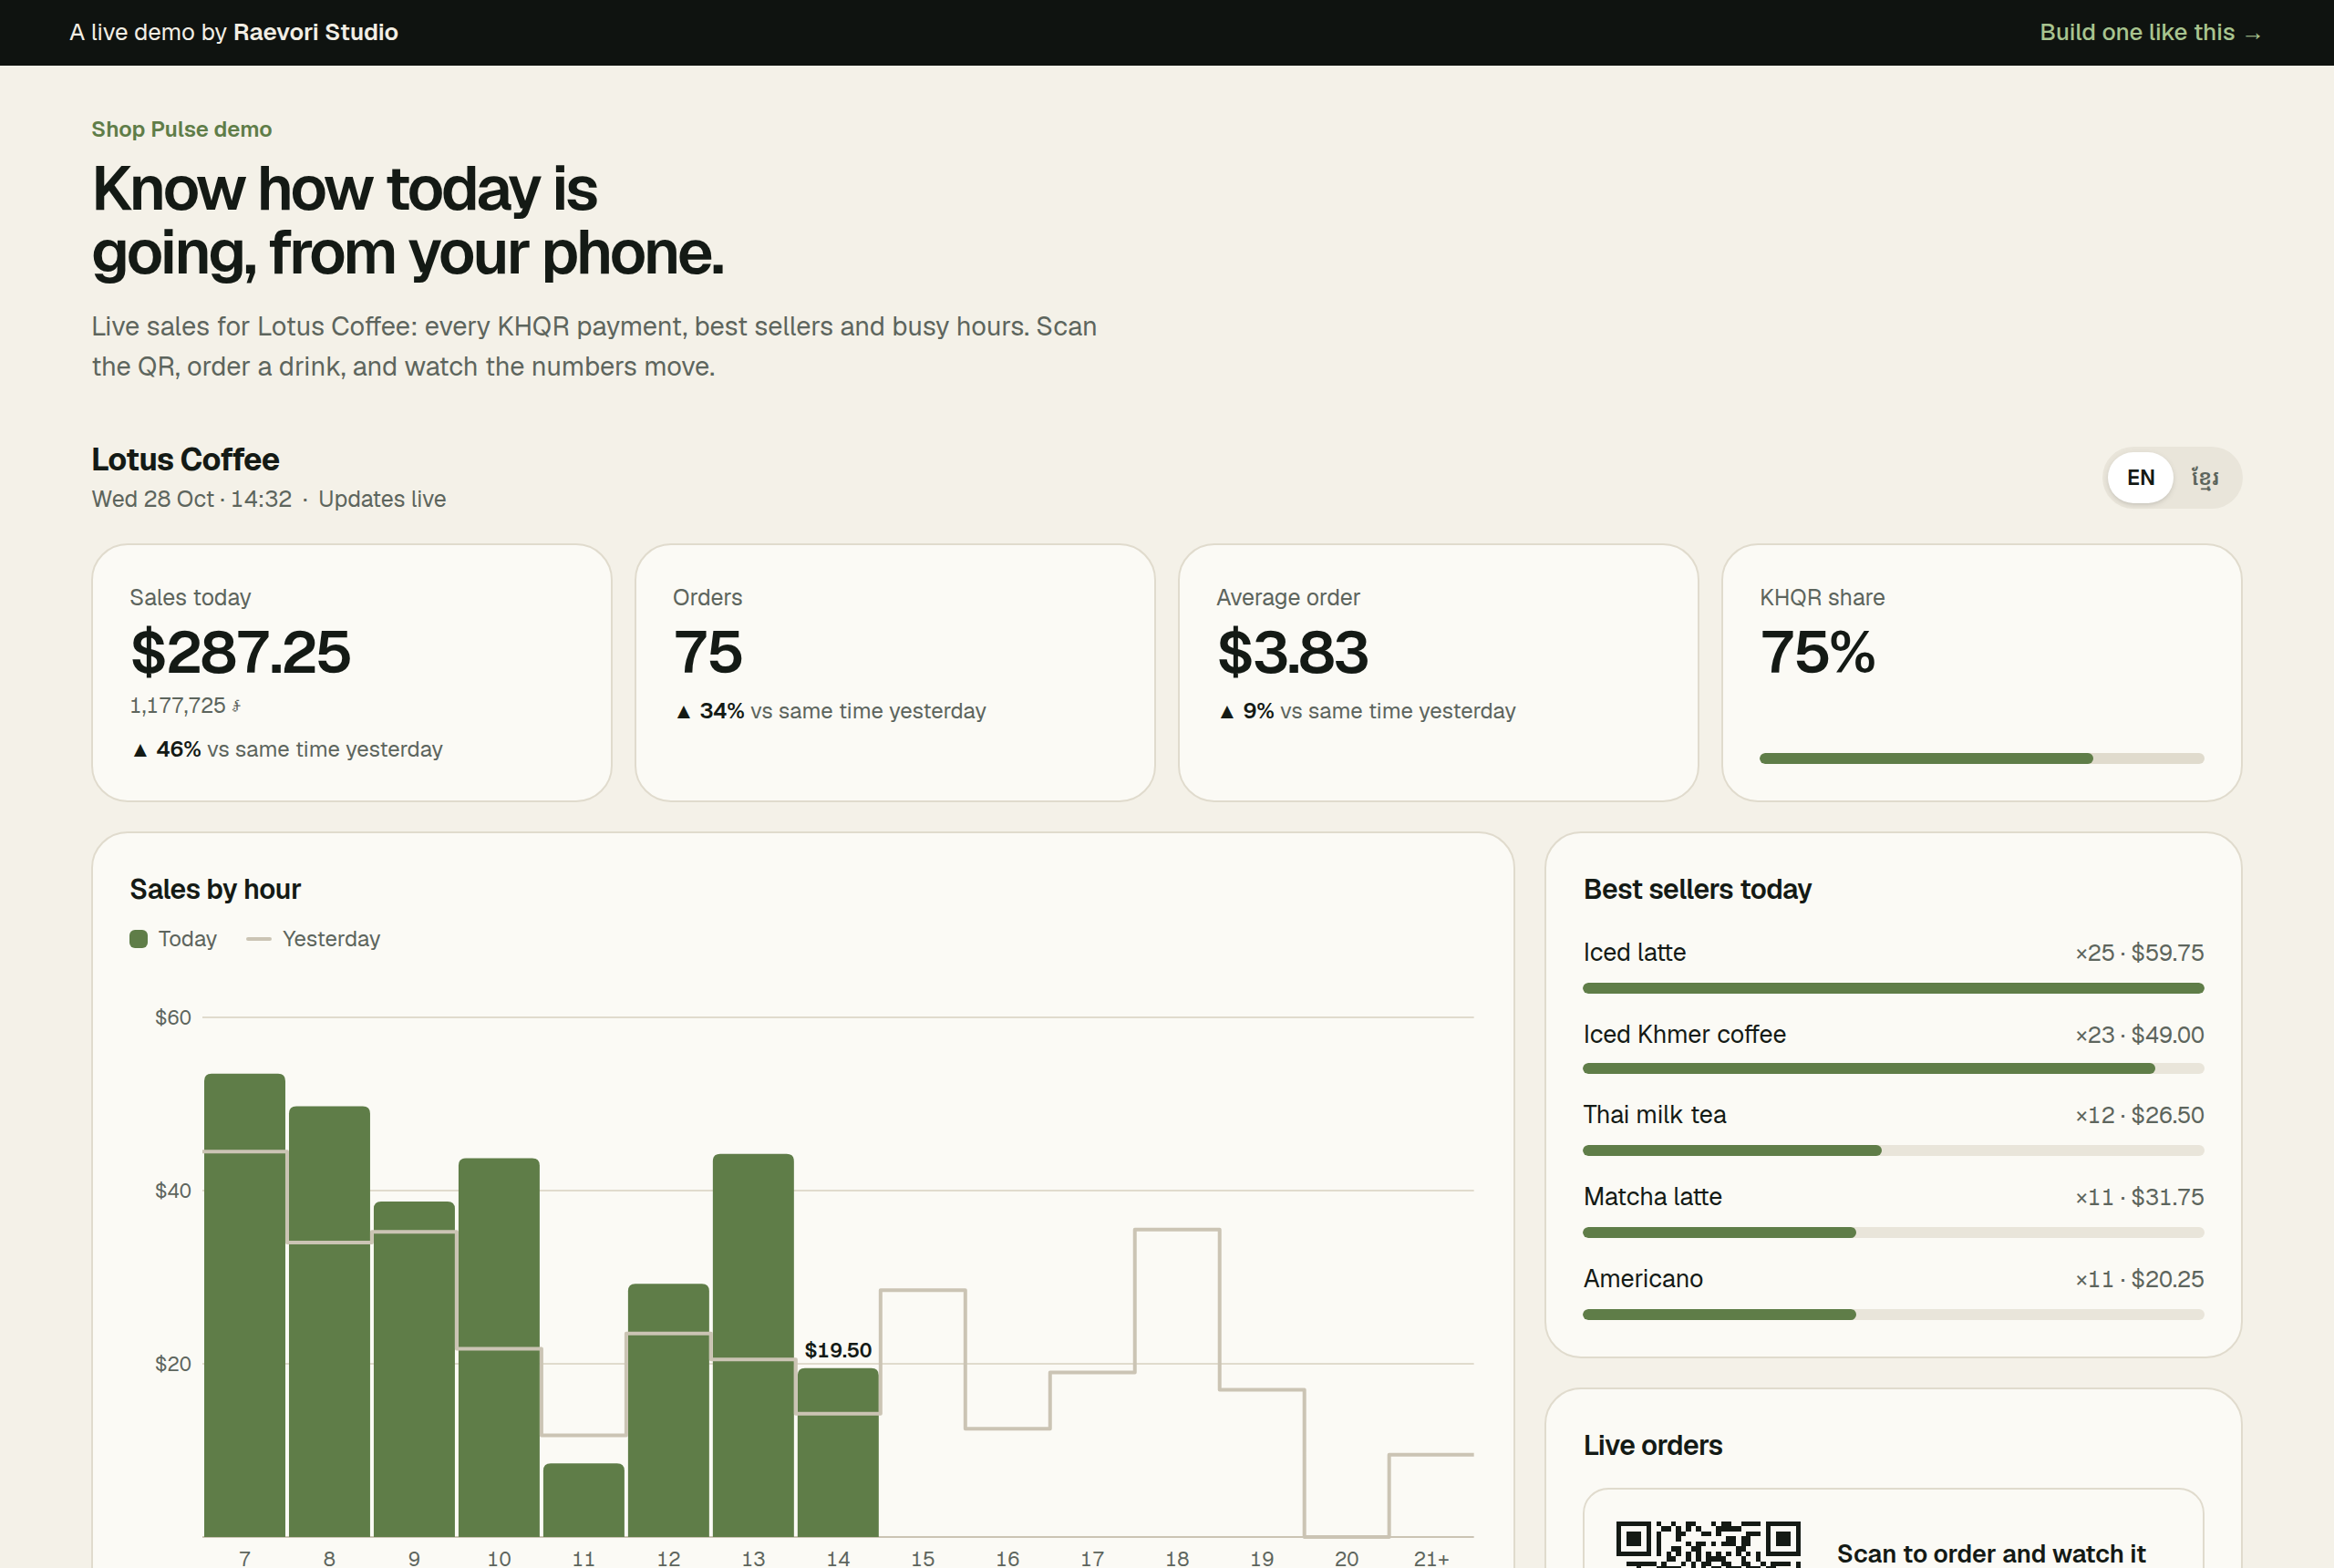
The dashboard on desktop, at 14:32 on a busy day.
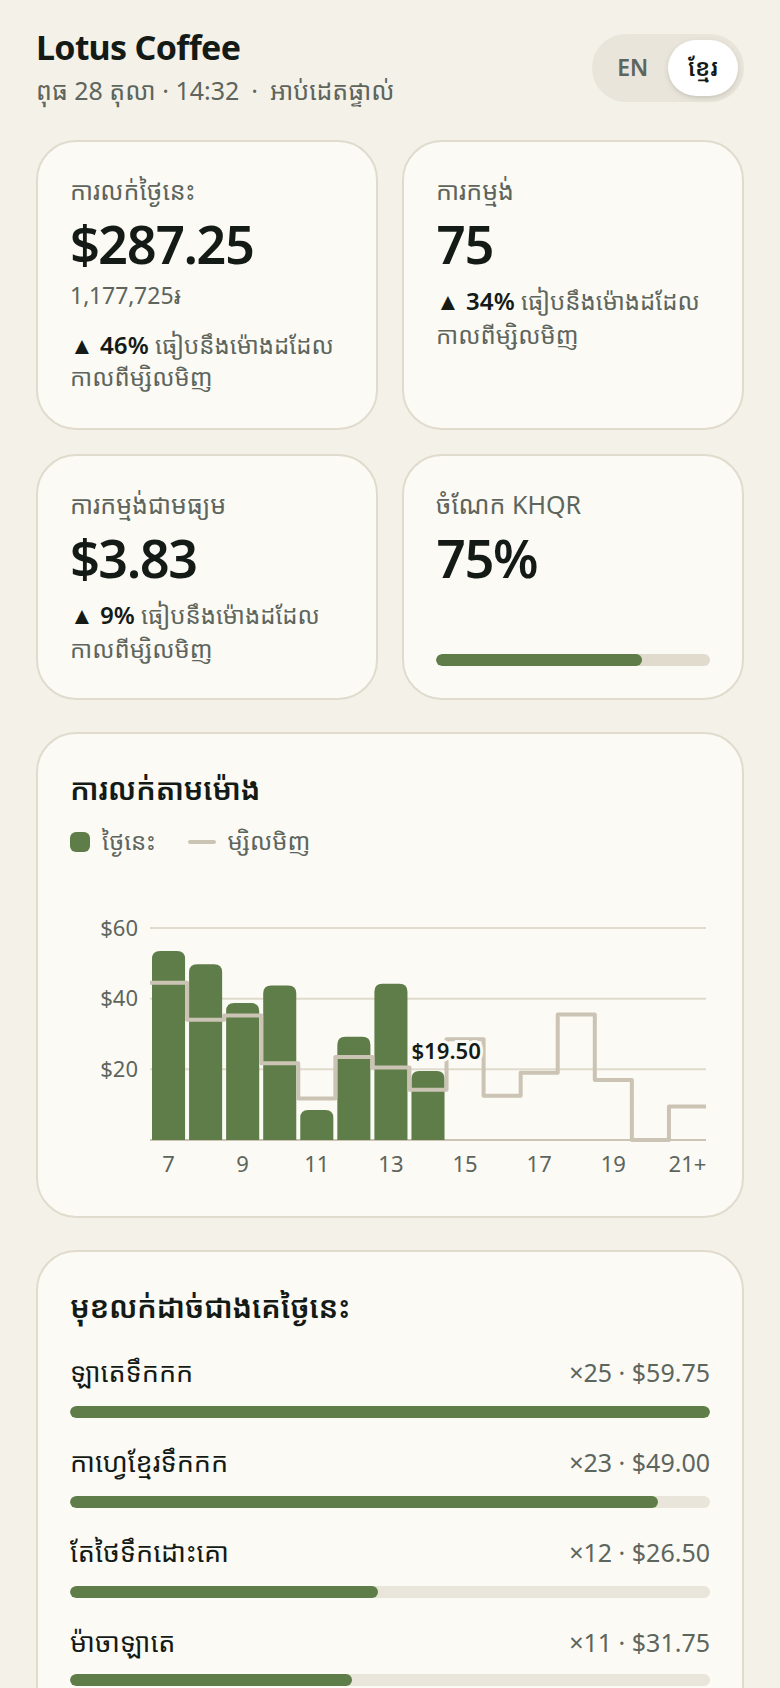
The whole dashboard switches to Khmer.
Simple parts, chosen to last
The same stack we use for client projects.
- Next.js
- React
- Server-Sent Events
- Dashboards
- Built with Next.js and React, so the dashboard reads well on a phone and on a laptop at the counter.
- It’s fed live by Table Order over Server-Sent Events. Order from the menu and the sale lands in the numbers a second later.
- Every figure comes from small, tested functions that count in cents, so the totals always add up.
- The charts are drawn in SVG with a data table behind each one for screen readers. In the demo, the history is made-up café data and the Telegram report is simulated.
Want one for your business?
We build it around your menu or your products, at a fixed price agreed up front.
Let’s build your project.
Tell us your idea. Free reply within 1 day.